The USDA recently released a report on Land Use in the United States. The data the report used covered the time period through 2012.
Here are the overall summary numbers from the report:
The U.S. land area totals just under 2.3 billion acres. Major land uses in 2012 included grass-land pasture and rangeland at 655 million acres (29 percent of the U.S. total), forest-use land at 632 million acres (28 percent), cropland at 392 million acres (17 percent), special uses (primarily parks and wildlife areas) at 316 million acres (14 percent), miscellaneous uses (such as wetlands, tundra, and unproductive woodlands) at 196 million acres (9 percent), and urban land at 70 million acres (3 percent).
In this post, I am featuring three of the graphs from the land use report that I found especially interesting.
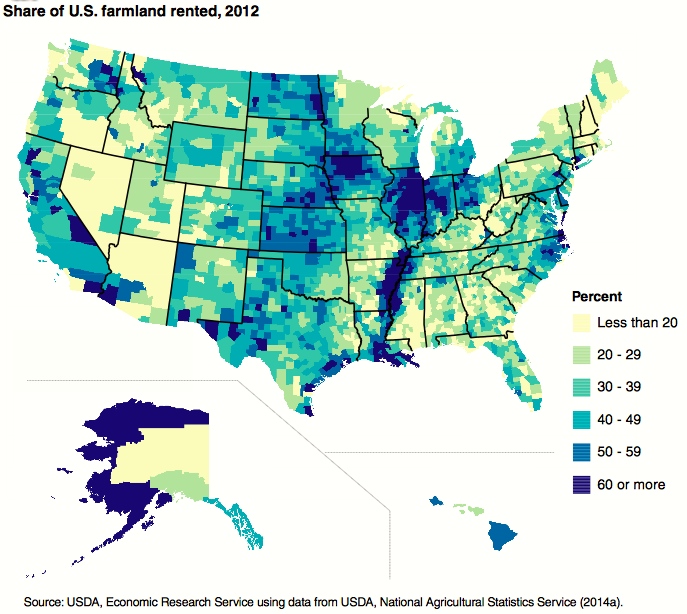
This first graph shows, by state, how much land is rented. Iowa and Illinois have high proportions of land rented.
 |
| Percent of U.S. farmland rented |
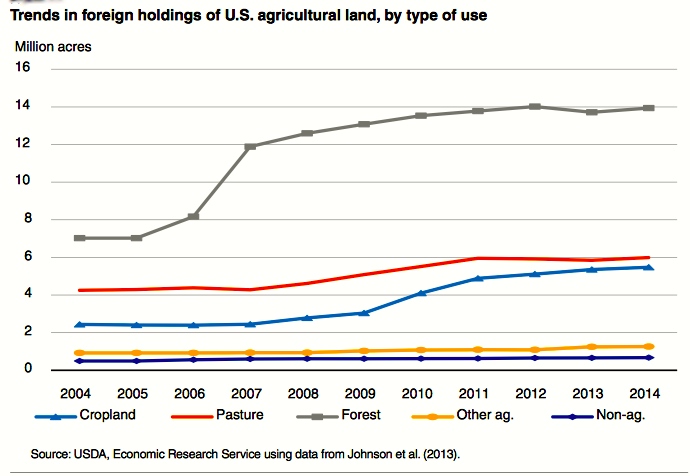
Next, is a graph that shows how much U.S. land is foreign-owned by category. Forest leads by far, followed by pasture, and then cropland.
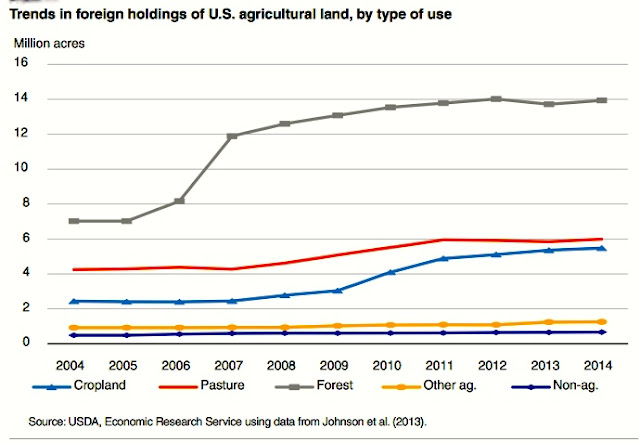 |
| Foreign ownership of U.S. agricultural land |
Here is the report's summary about the land ownership:
About 60 percent (1.37 billion acres) of the land in the United States is privately owned. The Federal Government owns approximately 28 percent (644 million acres), over a third of which is in Alaska. State and local governments own just over 8 percent (189 million acres). The remainder, about 3 percent (63 million acres), is held in trust by the Bureau of Indian Affairs. Total federally owned land declined by 9 million acres between 2007 and 2012. About 2 percent (25 million acres) of U.S. farm and forestland was foreign owned in 2012.
This last graphic shows proportions, by state, of land use broken into categories of grassland, cropland, and forest. I'm surprised how much of Minnesota and North Dakota are cropland.
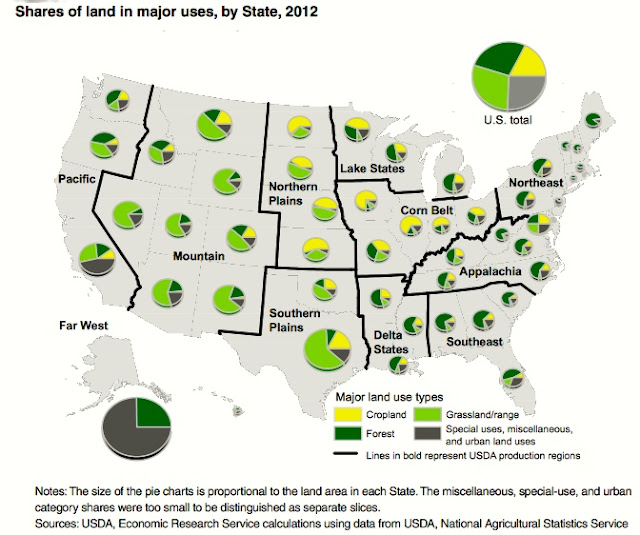 |
| Land use by State in the U.S. |
Here are summarized numbers about cropland from this report:
Total cropland includes land planted for crops (87 percent of total cropland), cropland used for pasture, and idled cropland (including acreage removed from production under Government programs, such as USDA’s Conservation Reserve Program). Between 2007 and 2012, total cropland decreased by 16 million acres to its lowest level since this series began in 1945. However, harvested cropland (which accounts for most land planted to crops) increased by 3 million acres due to favorable market conditions for several major commodities (including corn). A 23-million-acre decrease in cropland pasture contributed to the overall decline in cropland. The drop partly stemmed from changes in the methodology used in the Census of Agriculture in 2007 and 2012. As a result, it is likely that some land formerly identified as crop- land pasture is categorized as permanent grassland pasture and range in this study.
How much have these numbers changed since 2012, and where are they headed?
Source: Major Uses of Land in the United States, 2012 by Daniel P. Bigelow and Allison Borchers ERS USDA