"While ocean freight rates at the end of April 2011 were somewhat higher than in February 2011, they were still less than a fourth of the peak levels reached in 2007 and 2008, largely reflecting the increase in shipping capacity."
Ocean freight rates affect the cost of imported food commodities. As food commodity prices increased leading up to the 2008 peak, dry bulk freight rates rose even more rapidly, increasing more than 350 percent between January 2006 and November 2007. High oil prices, increased demand for ocean shipping, and slow growth in the availability of dry bulk shipping vessels were the major factors contributing to higher freight rates. By the end of 2008, ocean freight rates had plummeted more than 90 percent as a result of lower oil prices, reduced demand associated with the global recession, and an increase in the number of ships.
In the 12 months preceding February 2011, dry bulk freight rates did not increase or contribute to higher prices for imported food commodities. While ocean freight rates at the end of April 2011 were somewhat higher than in February 2011, they were still less than a fourth of the peak levels reached in 2007 and 2008, largely reflecting the increase in shipping capacity.
source: usda
Though the amount of bulk shipping being done is increasing annually, the build out of vessels is making competition fierce and may result in some scrapping by those unable to make a profit in the industry. To put grain bulk shipping into perspective for the industry, here are some stats from World-grain:
- The grain trade contributes less than 10% to total annual global ton-mile demand for bulk carriers.
- In the next four years the dry bulk fleet is expected to grow by some 2,900 new vessels, for a net gain of about 30% to 40%.
- More volumes moving on U.S.-Asia and South America routes will continue to see grain’s contribution to global ton-mile demand grow.
- In 2009, ton-mile demand (for grain) totaled 1,109 billion ton-miles. This was forecast to have risen to 1,310 in 2010 and is expected to climb again in 2011 to 1,407 billion ton-miles.
- In 2010, India imported over 80 million tonnes of coal from Indonesia.
- In 2009, China imported close to 628 million tons of iron ore.
- In 2010, China imported 164.83 million tons of coal.
- Brazil's mining company, Vale estimates its annual iron ore production will hit 311 million tonnes in 2011, increasing output to 522 million tonnes by the end of 2015. (Australia is still the largest supplier of ore to China.)
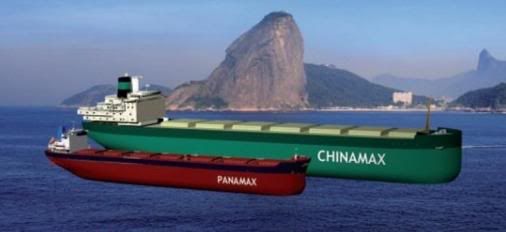
Enter the giant Chinamax vessel in 2011:
Greatly adding to global dry shipping supply competition is the new Chinamax. The 400,000-tonne dry bulk carrier introduced this year will cut the cost of iron ore freight into China from Brazil, and these vessels will also be used for coal shipments in the future.
Brazil's Vale mining company is planning to build 80-100 Chinamax vessels to drive down shipping rates so that the differential between Brazil-China freight and Australia-China is minimal. This competition may drop capesize rates to 1977 levels of $10,000 to $12,000 per day, according to Reuters. These giant carriers may reduce shipping by 50% for Vale to $7 a tonne.
Ports that can handle this size vessel, other than Brazil, include Rotterdam, Oman, and Malaysia. Ore will be transferred to capesize vessels from these large ports to be distributed to China and the Middle East.
KM
__________________________
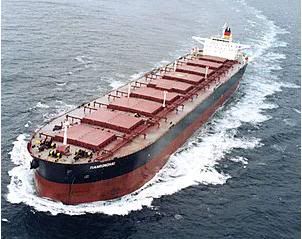
(Hyundai) cape size vessel
From wikipedia:
Capesize vessels are typically above 150,000 long tons deadweight (DWT), and ships in this class include oil tankers in the Very Large Crude Carrier (VLCC) and Ultra Large Crude Carrier (ULCC) classes; supertankers and bulk carriers transporting coal, ore, and other commodity raw materials. The term "capesize" is most commonly used to describe bulk carriers rather than tankers. A standard capesize bulker is around 175,000 DWT, although larger ships (normally dedicated to ore transportation) have been built, up to 400,000 DWT. The large dimensions and deep drafts of such vessels mean that only the largest deep water terminals can accommodate them.
__________________________
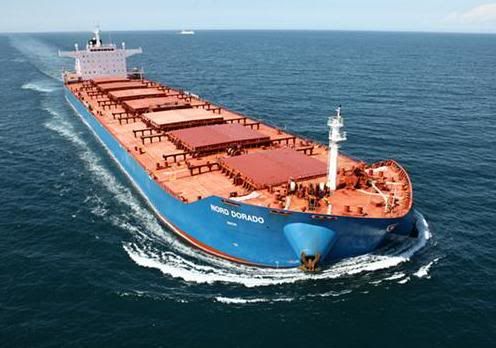
Post Panamax (Nord Dorado)
From wikipedia:
Post-Panamax or over-Panamax denote ships larger than Panamax that do not fit in the canal, such as supertankers and the largest modern container ships. The 'largest oil tanker in the world' — whichever ship held the title at the time — has not been able to transit the Panama Canal at least since the Idemitsu Maru was launched in the 1960s; she was about 150,000 deadweight tons. U.S. Navy supercarriers are also in the post-Panamax class; the Nimitz class aircraft carriers are 1,092 ft (332.84 m) long overall with a beam of 134 ft (40.84 m), while the flight deck is 252 ft (76.81 m) wide.
__________________________
Also see previous posts:
At What Oil Price Does it Pay to Ship Agricultural Products?
ADM Invests Big in Uruguay Port