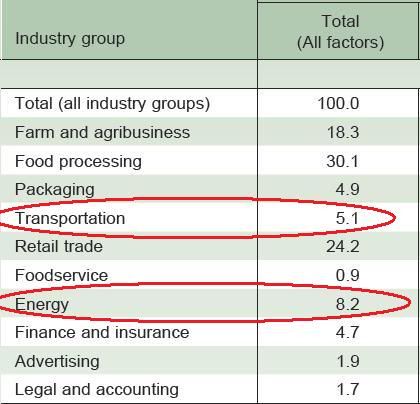
Of the 2008 food-at-home dollar, processors command largest industry group share, while salaries represent largest primary factor share...
Source: USDA, Economic Research Service
KM: Always liking to focus upon the energy and transportation issues as related to food security here in the U.S., this is more from Patrick Canning. This break-down of the industry expenses for the at-home food dollar obviously changes as the price of energy changes.
Part of the current slack in energy use in our food system is our overly processed convenience food, our nice and luxurious food retail outlets with their extravagant refrigeration displays, and the convenient, attractive packaging that we are accustomed to today. Always based upon what the consumer can afford, expect these three components to diminish as energy costs increase.
As energy becomes more expensive, will the small corner grocery store with bulk food bins make a come-back or will we adjust by motoring to the larger more efficient stores less often, perhaps by way of scooters, bicycles and buses instead of big SUV's? or both?
To learn more see:
- Amber waves June 2011: http://www.ers.usda.gov/AmberWaves/June11/PDF/AW_June11.pdf
- A Revised and Expanded Food Dollar Series: A Better Understanding of Our Food Costs, by Patrick Canning, ERR-114, USDA, Economic Research Service, February 2011, available at: www.ers.usda.gov/publications/err114/
- Food Dollar Series, available at: www.ers.usda.gov/data/fooddollar/