Map of Percent of U.S. Land in Farms in 2007
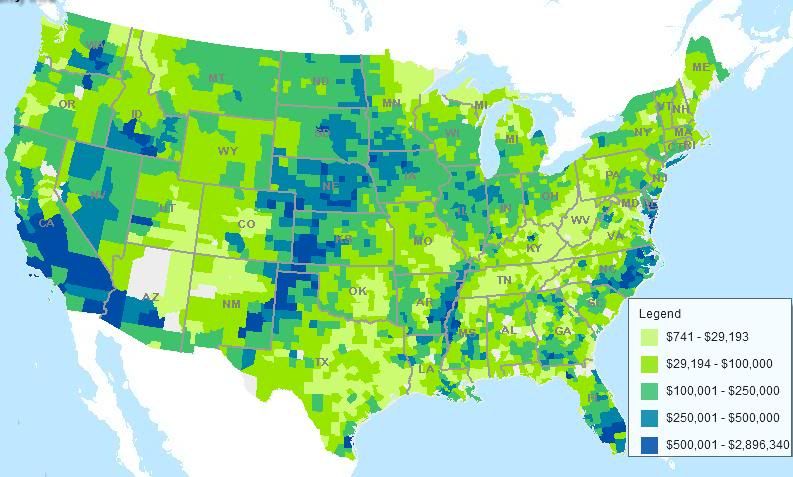
Map Showing the Average Value of Agricultural Products Sold in the U.S. in 2007
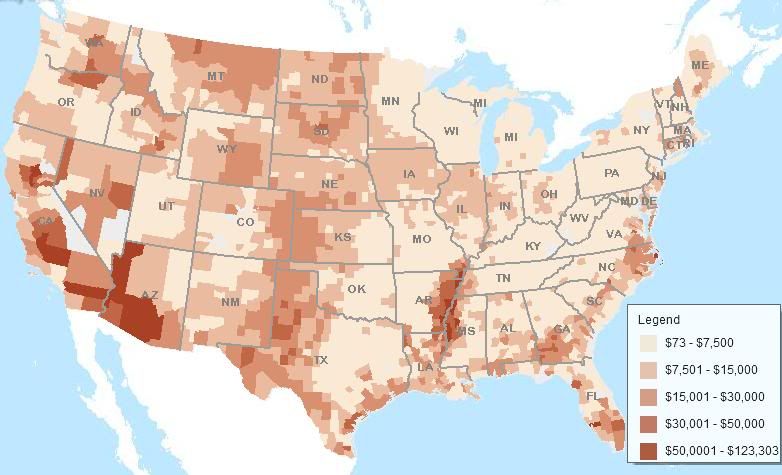
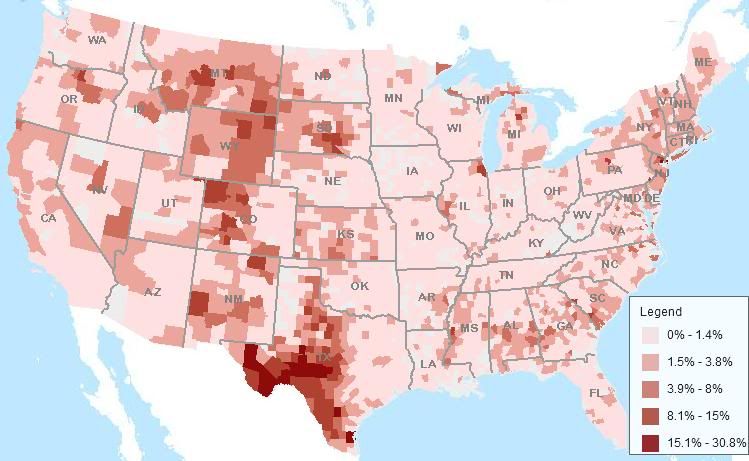
Map of U.S. Government Payments Per Farm Operation in 2007
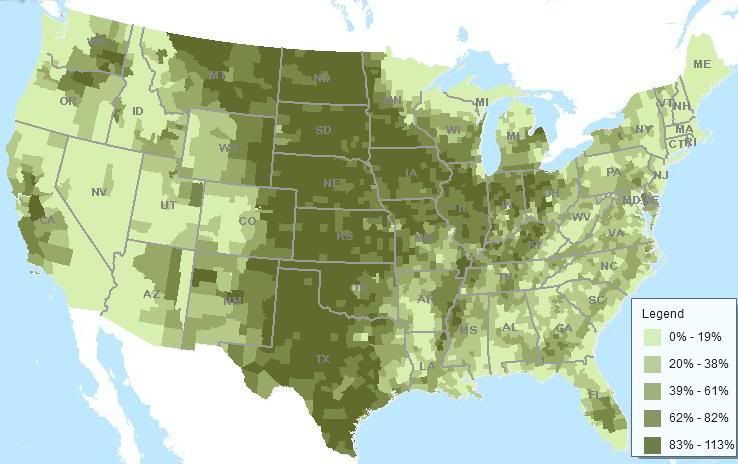
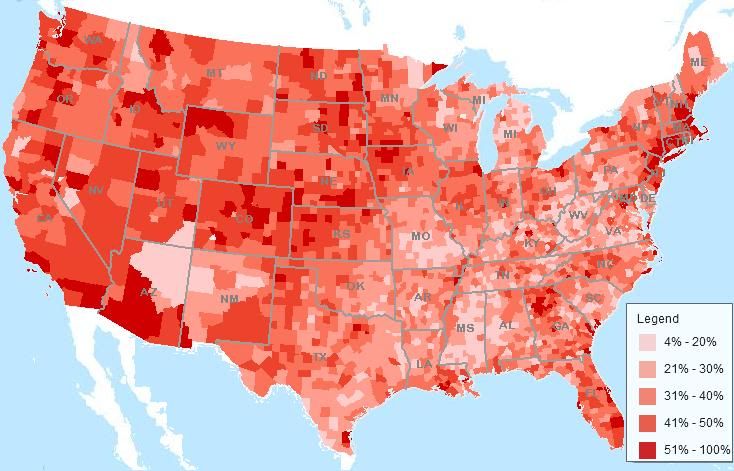
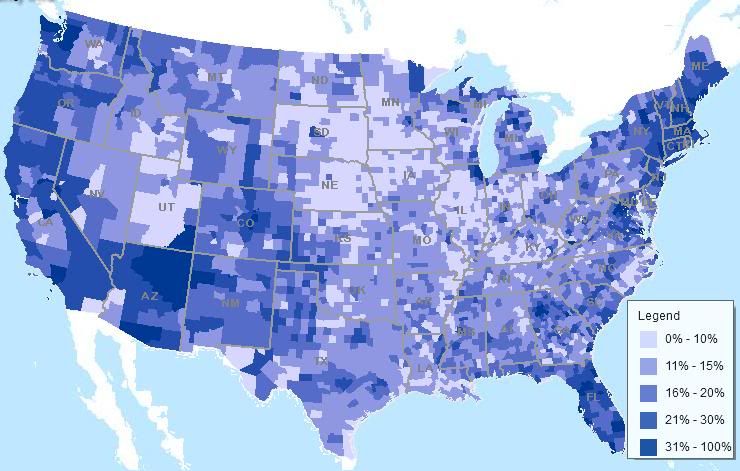
Map of Percent of U.S. Farm Operators working off-farm in 2007
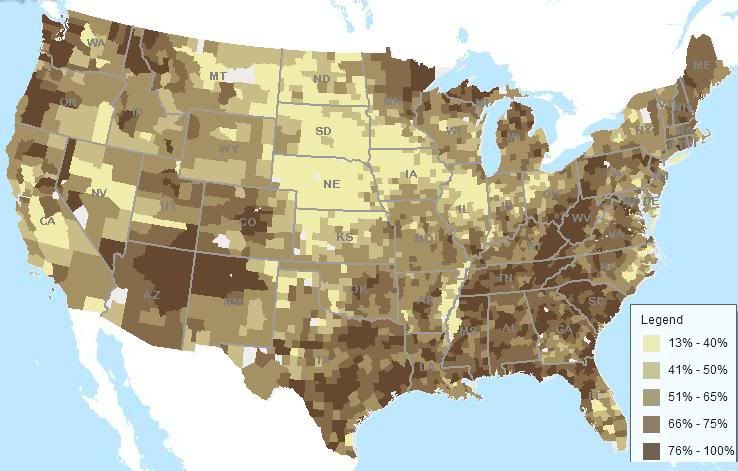
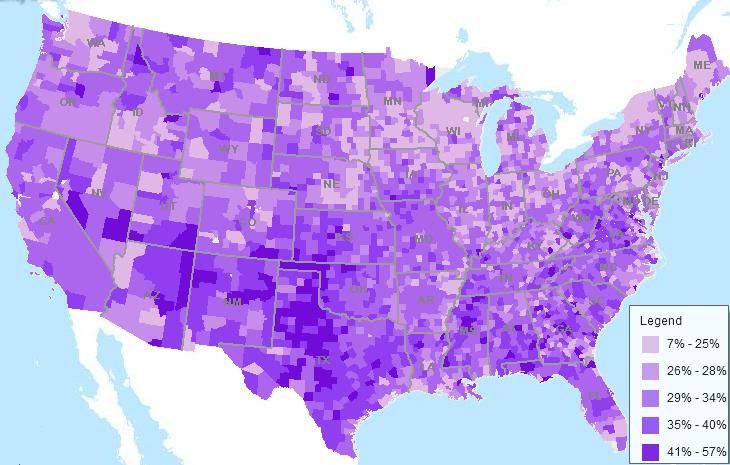
Map of Percent of U.S. Farms with less than $10,000 in Sales in 2007
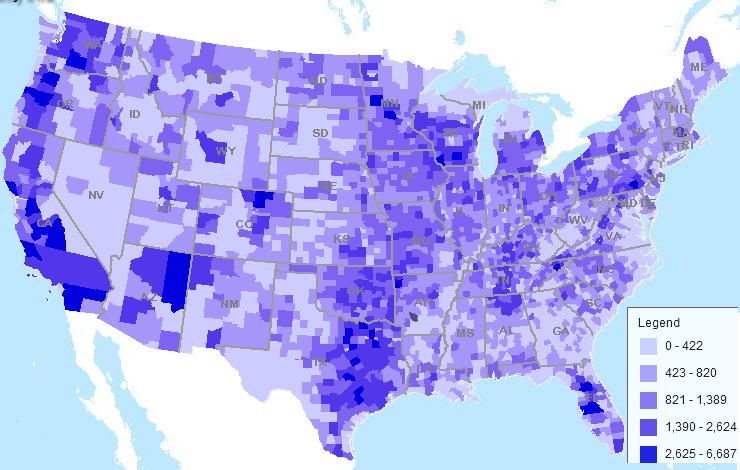
Map Showing Number of Farms in U.S. in 2007
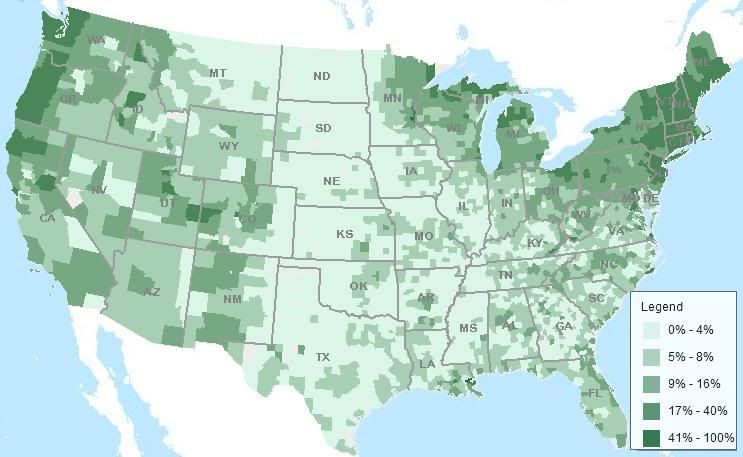
Map Showing Percent of Farms with High Speed Internet Access in 2007
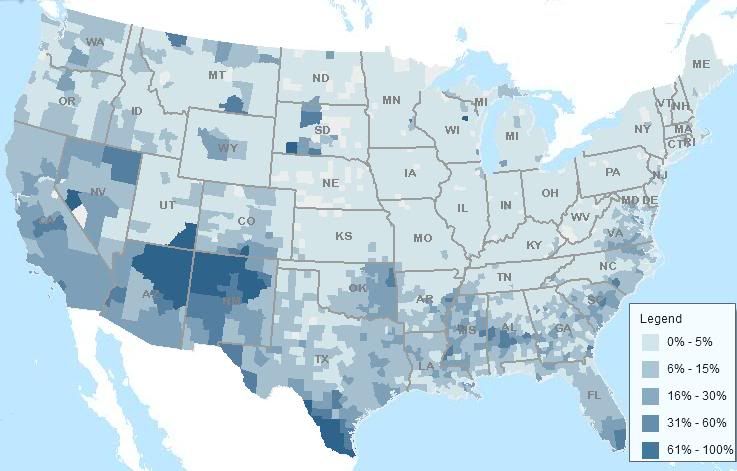
U.S. Map of Percent of Farms with Minority Operators 2007
Map Showing Percent of Farms with Women Operators in the U.S. in 2007
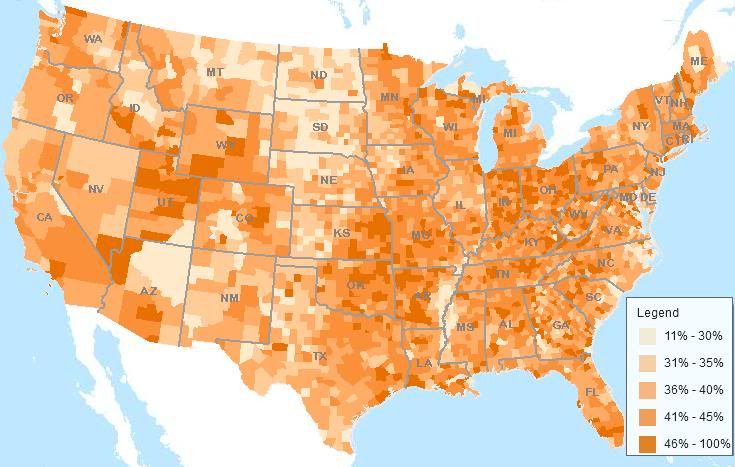
Map of Percent of U.S. Farm Operators sixty-five Years Old or Older 2007
Map Showing Percent of Farms with Direct Sales for Human Consumption 2007
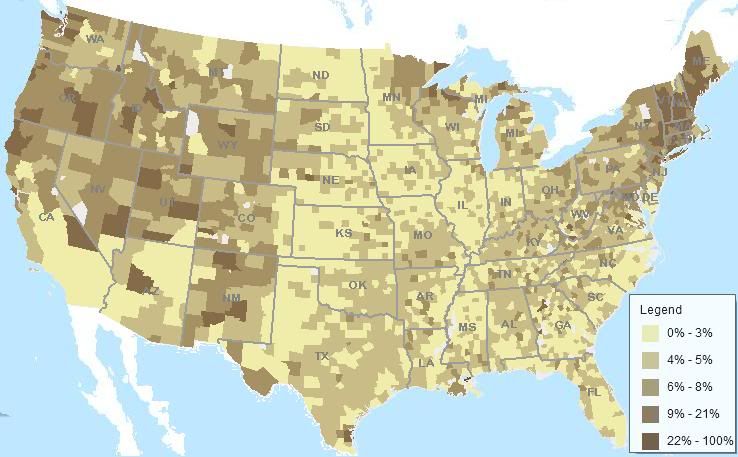
Map Showing U.S. Farms with Agritourism or Recreational Services 2007
Map: Percent of U.S. Farms with Value Added Commodities in 2007
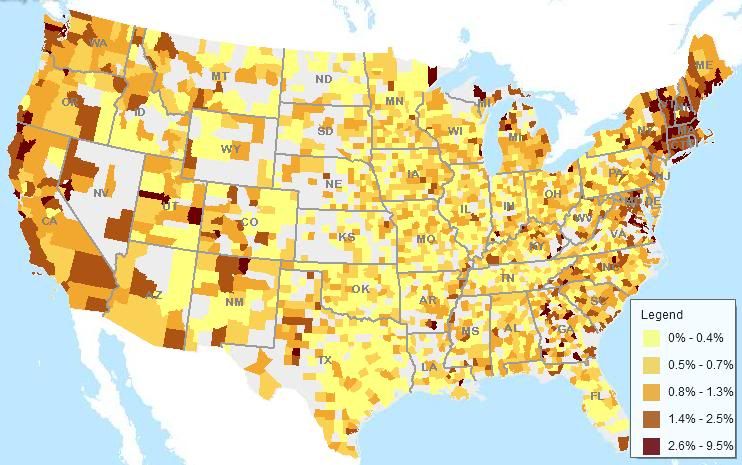
Map of Percent of Farms Using Community Supported Agriculture (CSA) 2007
Source: Farm Atlas ERS
Map Showing the Average Value of Agricultural Products Sold in the U.S. in 2007
Map of U.S. Government Payments Per Farm Operation in 2007
Map of Percent of U.S. Farm Operators working off-farm in 2007
Map of Percent of U.S. Farms with less than $10,000 in Sales in 2007
Map Showing Number of Farms in U.S. in 2007
Map Showing Percent of Farms with High Speed Internet Access in 2007
U.S. Map of Percent of Farms with Minority Operators 2007
Map Showing Percent of Farms with Women Operators in the U.S. in 2007
Map of Percent of U.S. Farm Operators sixty-five Years Old or Older 2007
Map Showing Percent of Farms with Direct Sales for Human Consumption 2007
Map Showing U.S. Farms with Agritourism or Recreational Services 2007
Map: Percent of U.S. Farms with Value Added Commodities in 2007
Map of Percent of Farms Using Community Supported Agriculture (CSA) 2007
Source: Farm Atlas ERS