In this report, you will see that the world stocks-to-use ratio of wheat is still at a higher level than its ten-year average. You will also see that the FSU region is the most variable in production, due to its weather volatility.
Thank you to Dan Obrien at Kansas State for the following information:
source: K-State
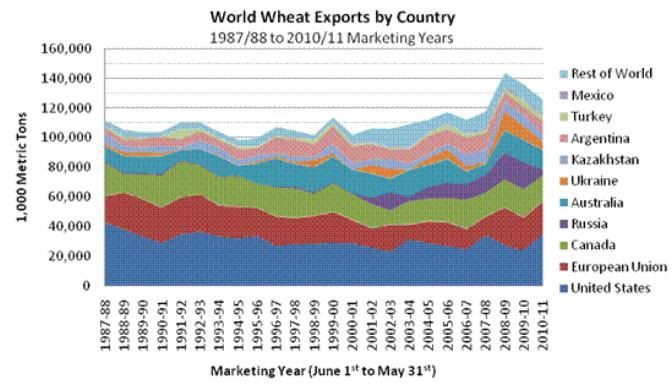
Global wheat production has been concentrated (84.3%) in the top 10 wheat producing countries and regions of the World since MY 1987/88, including the top 5 of 1) the European Union, 2) China, 3) India, 4) the United States, and 5) Russia. World wheat exports are also strongly influenced by a limited group of countries and regions, with the top 10 accounting for 91.6% of World wheat exports since MY 1987/88. The top 5 World wheat exporters at this time are 1) the United States, 2) the European Union, 3) Canada, 4) Russia, and 5) Australia, followed closely by the Ukraine, Kazakhstan, and Argentina.
source: K-State
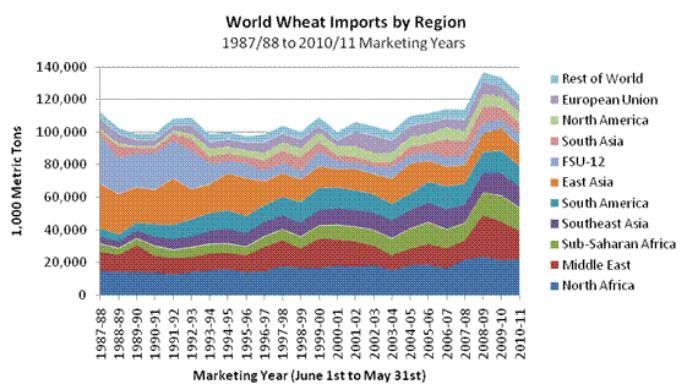
The top 12 world wheat importing countries over the last 10 years have accounted for approximately half of World wheat imports. World wheat imports in the 2010/11 marketing year are estimated to be 122,779,000 metric tons. This compares to average World wheat imports of 107,238,000 metric tons since the 1987/88 marketing year, with average increases of 912,000 metric tons per year over the 24 year period.
source: K-State
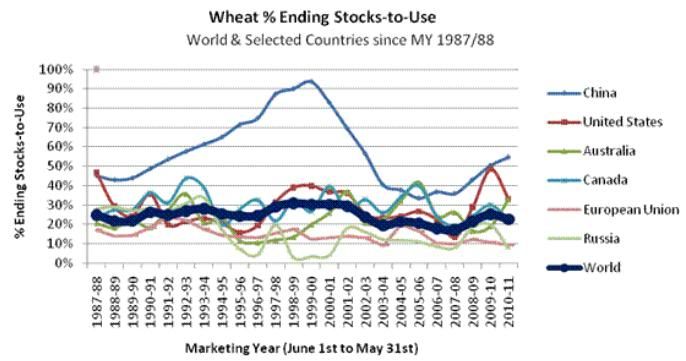
Total World wheat % ending stocks-to-use in the 2010/11 marketing year is projected to be 22.6 percent. This compares to average World wheat % ending stocks-to-use average of 24.5% since the 1987/88 marketing year, with average decreases of 0.2% per year over the 24 year period. Over the last 10 years (since MY 2001/02), World % ending stocks-to-use have averaged 21.9%, with trend decreases of 0.4% per year. Ending stocks of wheat in World markets tend to be concentrated in the hands of a limited number of countries or regions. Over the last 10 years, the top 10 wheat stocks-owning countries or regions have had ownership of 77.1% of total World wheat ending stocks. These countries include China, the United States, India, the European Union, Canada, Australia and Russia. Eqypt, Iran and Syria have also consistently been among the top 10 holders of World Wheat ending stocks over the last decade.
Sources:
Stu Ellis Univ. of Illinois
Dan Obrien Kansas State
Thank you to Dan Obrien at Kansas State for the following information:
source: K-State
Global wheat production has been concentrated (84.3%) in the top 10 wheat producing countries and regions of the World since MY 1987/88, including the top 5 of 1) the European Union, 2) China, 3) India, 4) the United States, and 5) Russia. World wheat exports are also strongly influenced by a limited group of countries and regions, with the top 10 accounting for 91.6% of World wheat exports since MY 1987/88. The top 5 World wheat exporters at this time are 1) the United States, 2) the European Union, 3) Canada, 4) Russia, and 5) Australia, followed closely by the Ukraine, Kazakhstan, and Argentina.
source: K-State
The top 12 world wheat importing countries over the last 10 years have accounted for approximately half of World wheat imports. World wheat imports in the 2010/11 marketing year are estimated to be 122,779,000 metric tons. This compares to average World wheat imports of 107,238,000 metric tons since the 1987/88 marketing year, with average increases of 912,000 metric tons per year over the 24 year period.
source: K-State
Total World wheat % ending stocks-to-use in the 2010/11 marketing year is projected to be 22.6 percent. This compares to average World wheat % ending stocks-to-use average of 24.5% since the 1987/88 marketing year, with average decreases of 0.2% per year over the 24 year period. Over the last 10 years (since MY 2001/02), World % ending stocks-to-use have averaged 21.9%, with trend decreases of 0.4% per year. Ending stocks of wheat in World markets tend to be concentrated in the hands of a limited number of countries or regions. Over the last 10 years, the top 10 wheat stocks-owning countries or regions have had ownership of 77.1% of total World wheat ending stocks. These countries include China, the United States, India, the European Union, Canada, Australia and Russia. Eqypt, Iran and Syria have also consistently been among the top 10 holders of World Wheat ending stocks over the last decade.
Sources:
Stu Ellis Univ. of Illinois
Dan Obrien Kansas State