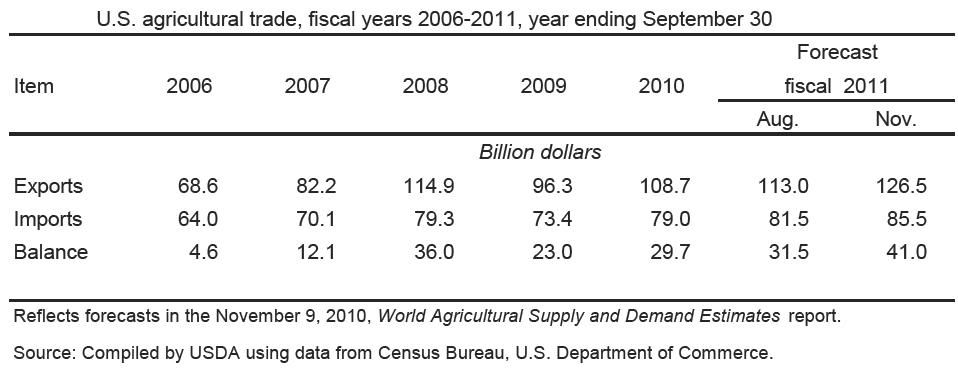
The U.S. agricultural import forecast for 2011 is moved up to $85.5 billion, an 8.2-percent increase over 2010. The projected import growth in 2011 reflects about 2-3 percent volume gain and 6 percent increase in import unit values. Major commodities inflating the U.S. import bill include coffee beans, cocoa beans, coconut oil, palm oil, rubber, and sugar.
Of the additional $7 billion in agricultural imports expected in 2011, about $2 billion is projected from sugar and tropical products, $3 billion from horticultural products, $700 million from livestock and dairy products, and $500 million from grain products.
About 20 percent of U.S. horticultural imports are processed fruits and vegetables, including juices but excluding wine. Combining fresh and processed produce with nuts, these imports comprise more than a quarter of the total value of U.S. agricultural imports. In fact, all fruit and vegetable imports, worth an estimated $22.1 billion in 2011, are nearly $2 billion more than all imports of sugar and tropical products, and $10.3 billion more than livestock and dairy imports.
In fiscal 2010, U.S. import unit values for sugar jumped 23 percent. Rubber import unit values went up even higher—by 26 percent as U.S. automobile production staged a significant rebound. Import unit values for cocoa, coffee, and tea were up from 11 to 19 percent in 2010.
The more than $200-million anticipated rise in U.S. beef imports in 2011 over 2010 is in part due to tight supplies of domestic processing beef.
Mexico, Canada, and the European Union are the leading contenders to supply most of the 8 percent forecasted farm product import growth in 2011. In terms of import volume (metric tons), the largest U.S. suppliers in 2010 were Canada, Mexico, Guatemala, Costa Rica, and Malaysia. By region, Southeast Asian countries export more than twice as much in volume of farm products to the U.S. as the European Union.
The EU, however, trails only Canada in terms of value of agricultural exports to the United States. After Mexico, South America is ahead of Southeast Asia in export value to the United States. These top 5 regions supply more than three-quarters of imported U.S. farm products.
The top four exporters of fresh vegetables to the United States are Mexico, Canada, Peru, and China. These countries make up 93 percent of the total imported supply.
By itself, Mexico supplies more than two-thirds of imported fresh vegetables. More than a third of U.S. fresh vegetable imports are tomatoes, and 83 percent are shipped north from Mexico. Although the share of imported fresh vegetables is only 18 percent of domestic consumption, 44 percent of tomatoes consumed are imported. The next largest fresh vegetable imports are sweet and chili peppers, two-thirds of which are supplied by Mexico.
The third largest vegetable imports are frozen potatoes, largely for French fries, from Canada. About 22 percent of French fries consumed in the United States are imported.
source: usda
Also see: Agricultural Imports Part II.