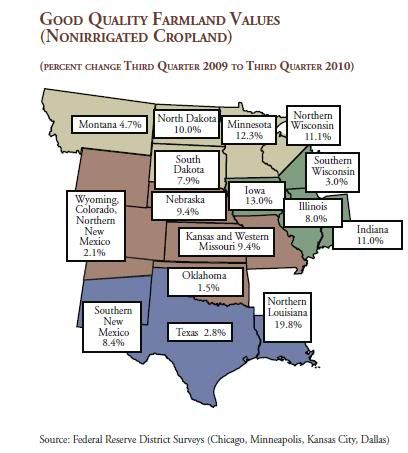
This map shows the percent price change in the year from 3rd Quarter 2009 to 3rd quarter 2010 of nonirrigated good quality farmland in the Midwest, as measured by the District Federal Reserve Office surveys.
For additional information on the Third Quarter Farm Price survey results of the District Federal Reserve offices, see this report "Third Quarter Federal Reserve District Bank Reports on Farmland Prices".